
QuikStrike was created to provide our users with fast, easy access to volatility information. The Vol Term Structure page makes it easy to compare at-the-money (ATM) implied volatility levels across all expirations on a single page. Using the Chart Settings and Expiration Filter dropdowns and the Expiration Table, users can create a personalized ATM implied volatility chart.
On the Vol Term Structure chart, our users can view and compare ATM implied volatilities from four different timeframes:
- Current ATM Levels
- Previous Settlement
- 1 Week ago
- 1 Month ago
Click the Chart Settings dropdown to select/deselect each vol term to be displayed on the chart.
Let’s look at the American Crude Oil Vol Term Structure page. The first thing to note is the Expiration Table that shows which expirations can be displayed on the chart. Toggle the Expiration Groups by clicking the Expiration Filter button. A dropdown will appear that allows you to select/deselect the Expiration Groups shown in the table. Click the box on the left of each expiration to select/deselect the expiration to have its corresponding implied volatility added/removed from the chart.
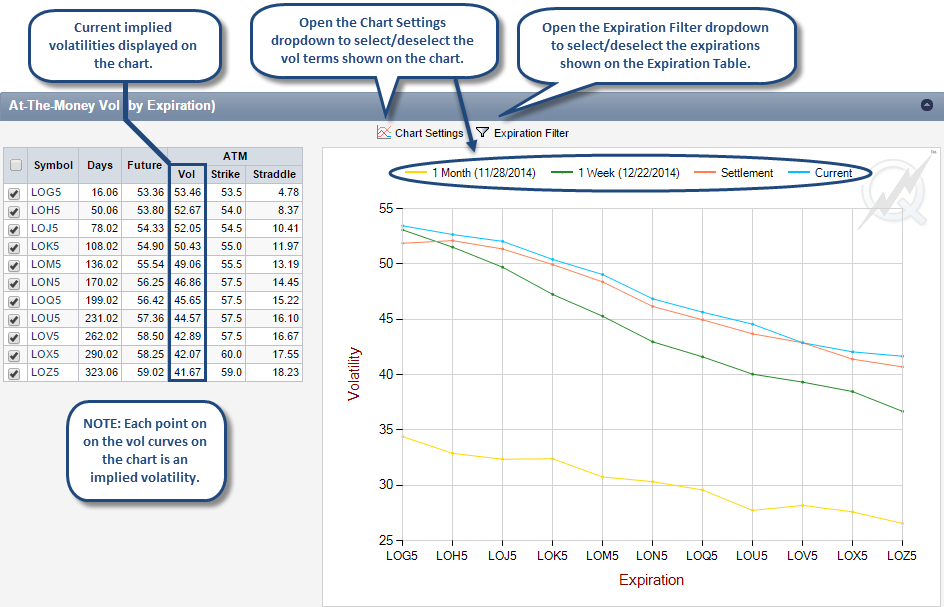
The Expiration Table also contains Days to Expiration (DTE), Future Price and ATM Implied Volatility, ATM Strike Price and Current Straddle Price columns (NOTE: the expirations shown in the table are listed in DTE order).
NOTE: You can hover over each point on the curve to view the corresponding expiration and volatility.
Many users leverage the Vol Term Structure page to compare only two or three expirations at a time, but the page is designed to build the chart as you please. Share with us how you use the page. Send us an email at [email protected]. Thanks for reading and please share our blog with others who may be interested.