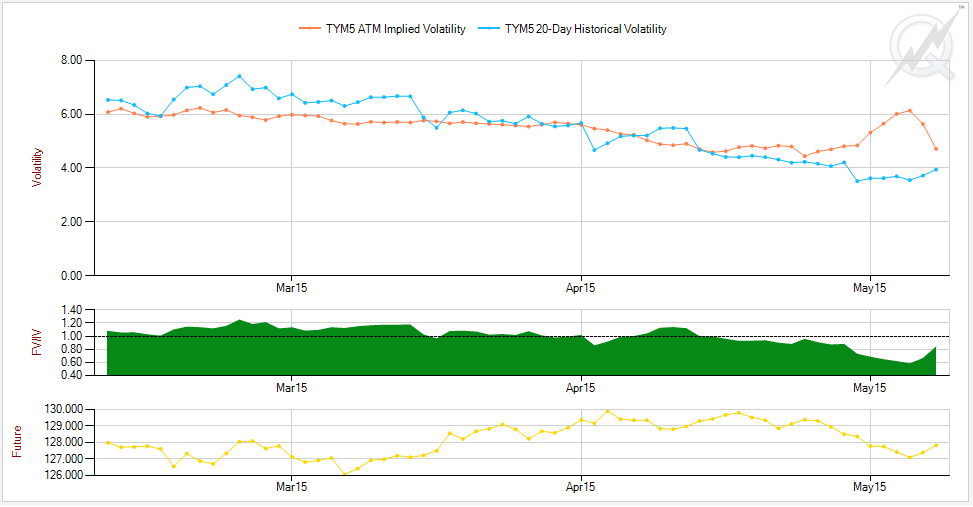
Calmer corn markets ahead? Volatility for March contract fell following Monday’s USDA report. @quikstrike1 pic.twitter.com/M2nAmU7HAv
— CME Group (@CMEGroup) January 13, 2015
In wake of Monday’s USDA report, the CME Group tweeted a QuikStrike ATM Vol History graph to showcase lower volatility in the March contract for Corn. Viewing this chart in QuikStrike takes a few simple steps.
In a prior blog post, we outlined the features of the History section in QuikStrike. Navigating to the Volatility and Skew → ATM Charts page will allow you to view ATM volatility history (1,3,6,9 and 12 month periods), as well as the corresponding Future Price for each date.
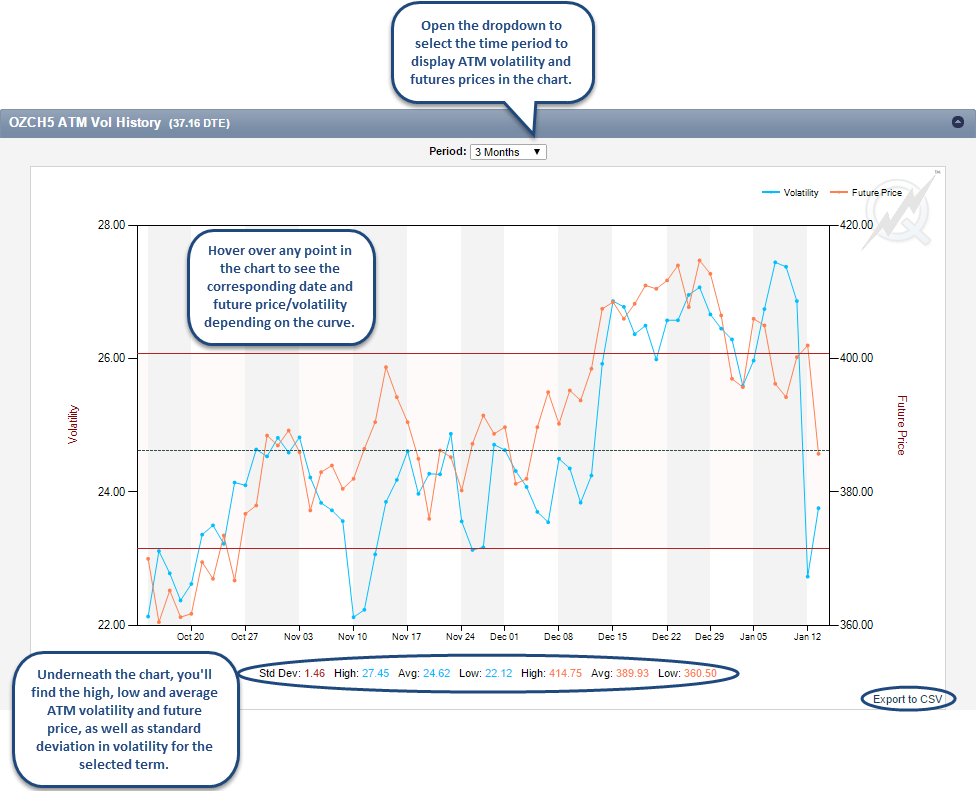
As you can see in the image above, the ATM volatility history chart gives you the opportunity to view the ATM volatility/future price and the corresponding date (going back as far as 12 months). You can also get a feel for the average ATM volatility and future price for a particular expiration over the selected time period at the bottom of the page.
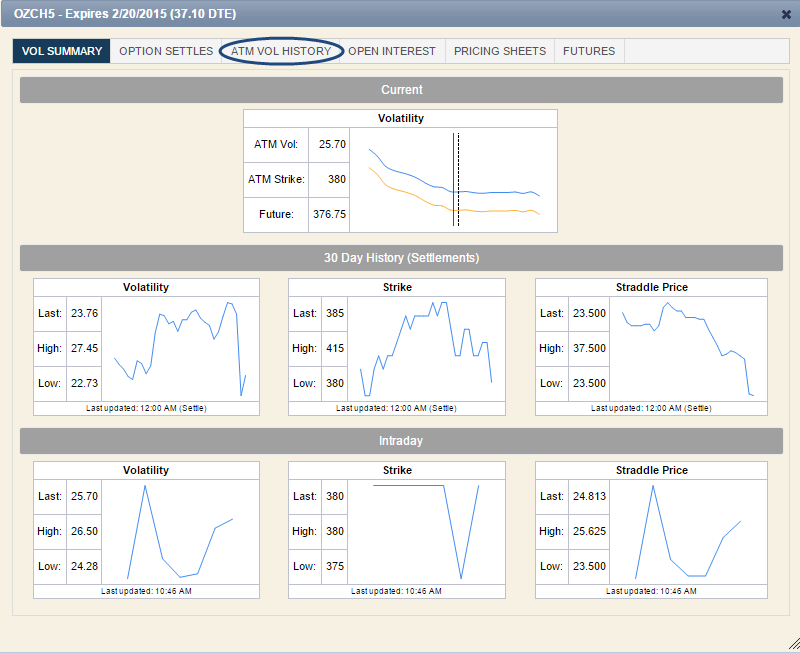
While we navigated to the History section of QuikStrike to create this graph, you can also access this information (via an Expiration Popup) by clicking on the expiration in the title bar (or any other place where the expiration is a link in QuikStrike). After you click the expiration, you will see the third tab from the left is ATM Vol History (as shown in the image below).
Once you click the ATM Vol History tab, you can view the exact same chart as the Volatility and Skew → ATM Charts page in the History section of QuikStrike without navigating to a new page. The Expiration Popup (shown in the image above) also includes Vol Summary, Option Settles, Open Interest, Pricing Sheets and Futures tabs for the selected expiration.
We want our users take advantage of all the ways to view vol history in QuikStrike. Let us know what you think about this chart, and the rest of the Volatility and Skew history pages. Get in touch with us via email, Twitter or post a comment below. Thanks for checking out our blog!